Using Predictive Fit to Inform Effect Metric Choice in Meta-Analysis
2025-06-11
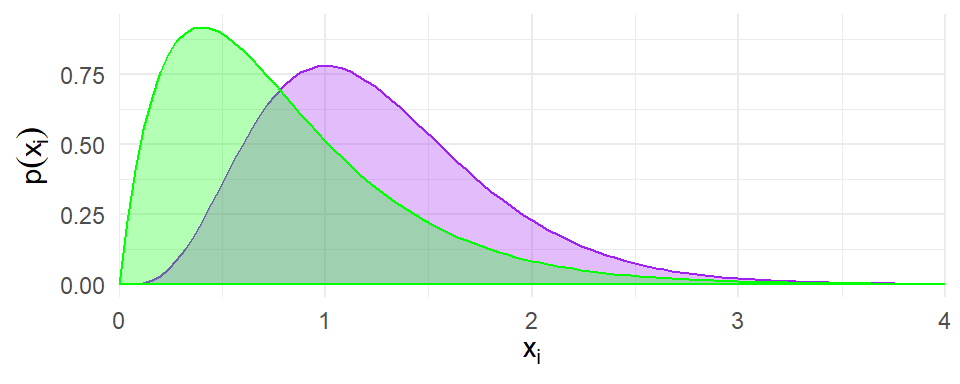
Leave-one-out predictive density
- Without using observation \(i\), make a prediction for observation \(i\) by specifying a density \(p_{(-i)}(x_i)\) (must integrate to one).
- Score higher by putting more density on the realized outcome.
\[ \text{Predictive score:} \ \log p_{(-i)}(x_i) \]
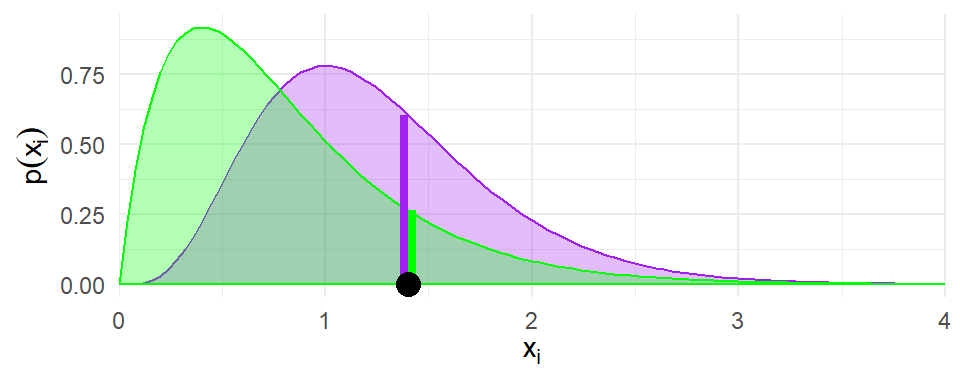
LOO-LPD is the sum of scores across \(N\) observations: \(\displaystyle{\text{LOO-LPD} = \sum_{i=1}^N \log p_{(-i)}(x_i)}\)
Higher LOO-LPD indicates better fit.
Agnostic to the metric of the prediction.
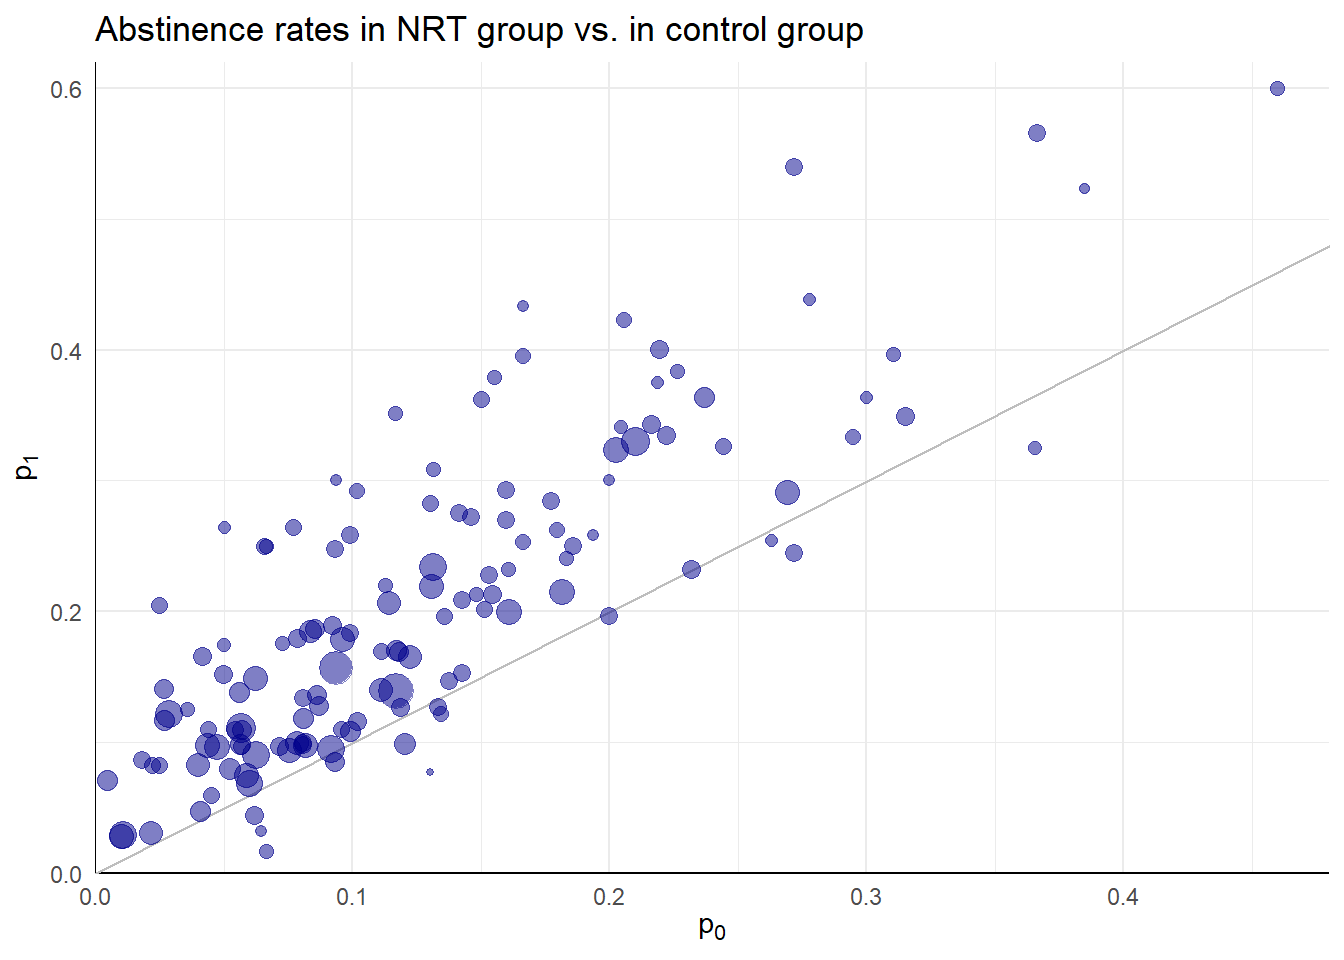
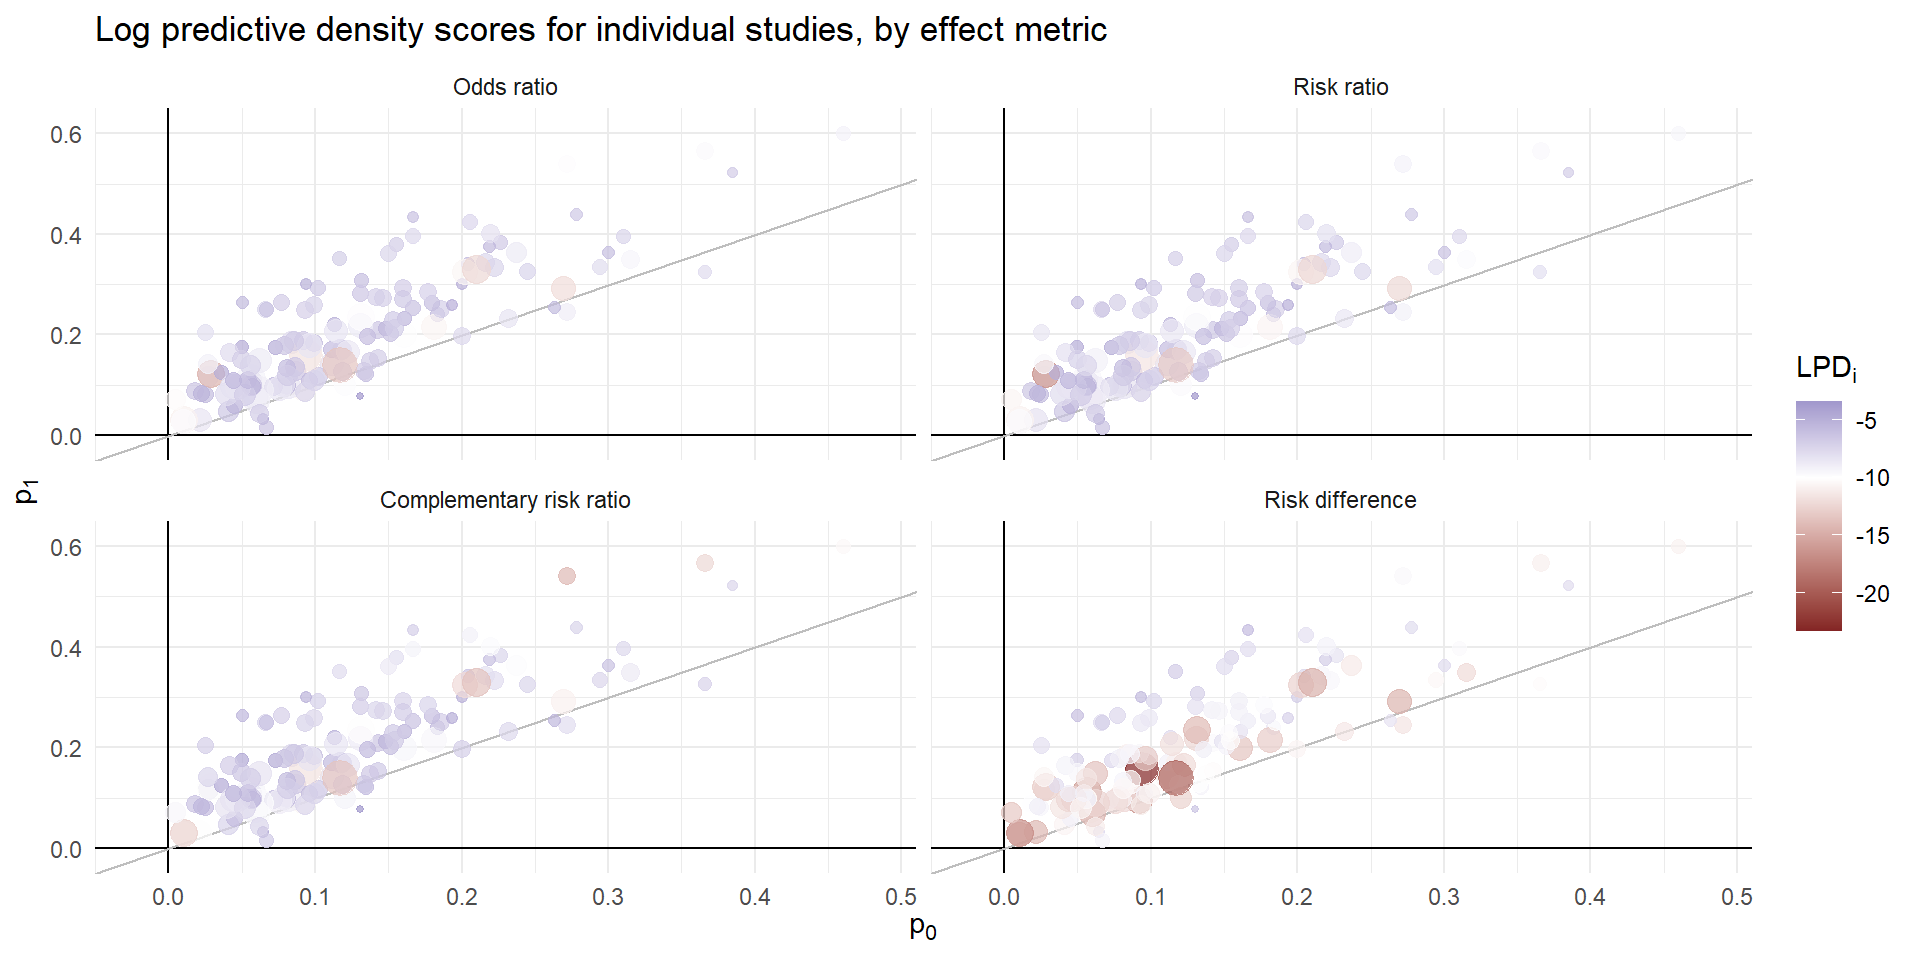
Effectiveness of nicotine replacement therapy
Cochrane Systematic Review of effects of nicotine replacement therapy vs. control on smoking cessation, defined as abstinence at 6+ month follow-up (Hartmann-Boyce et al. 2018).
Sample sizes ranging from \(N_i\) = 36 to 5290 (median = 240.5, IQR = 153.5 - 428.5).
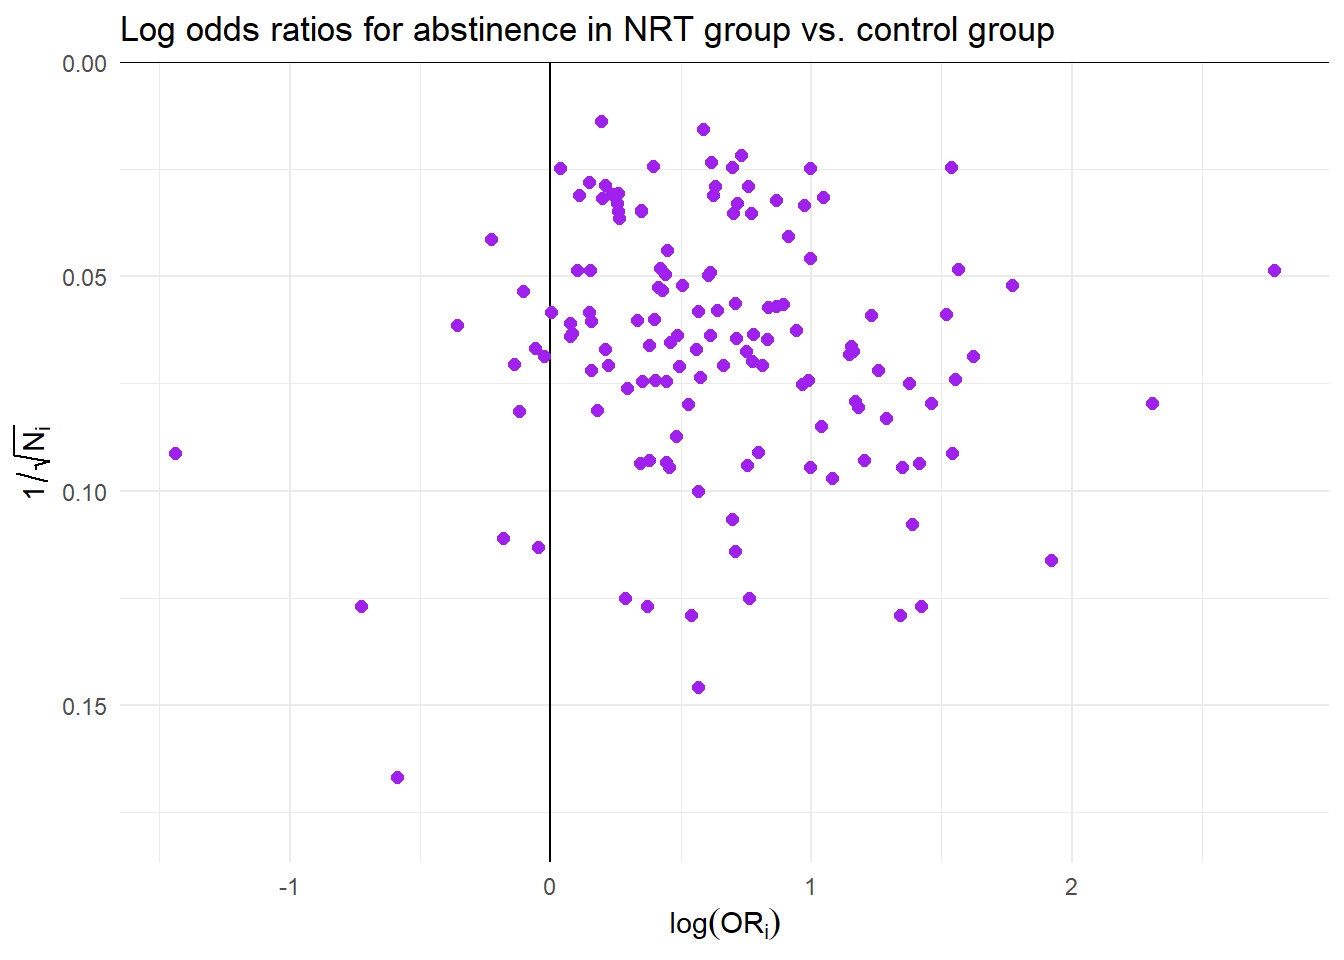
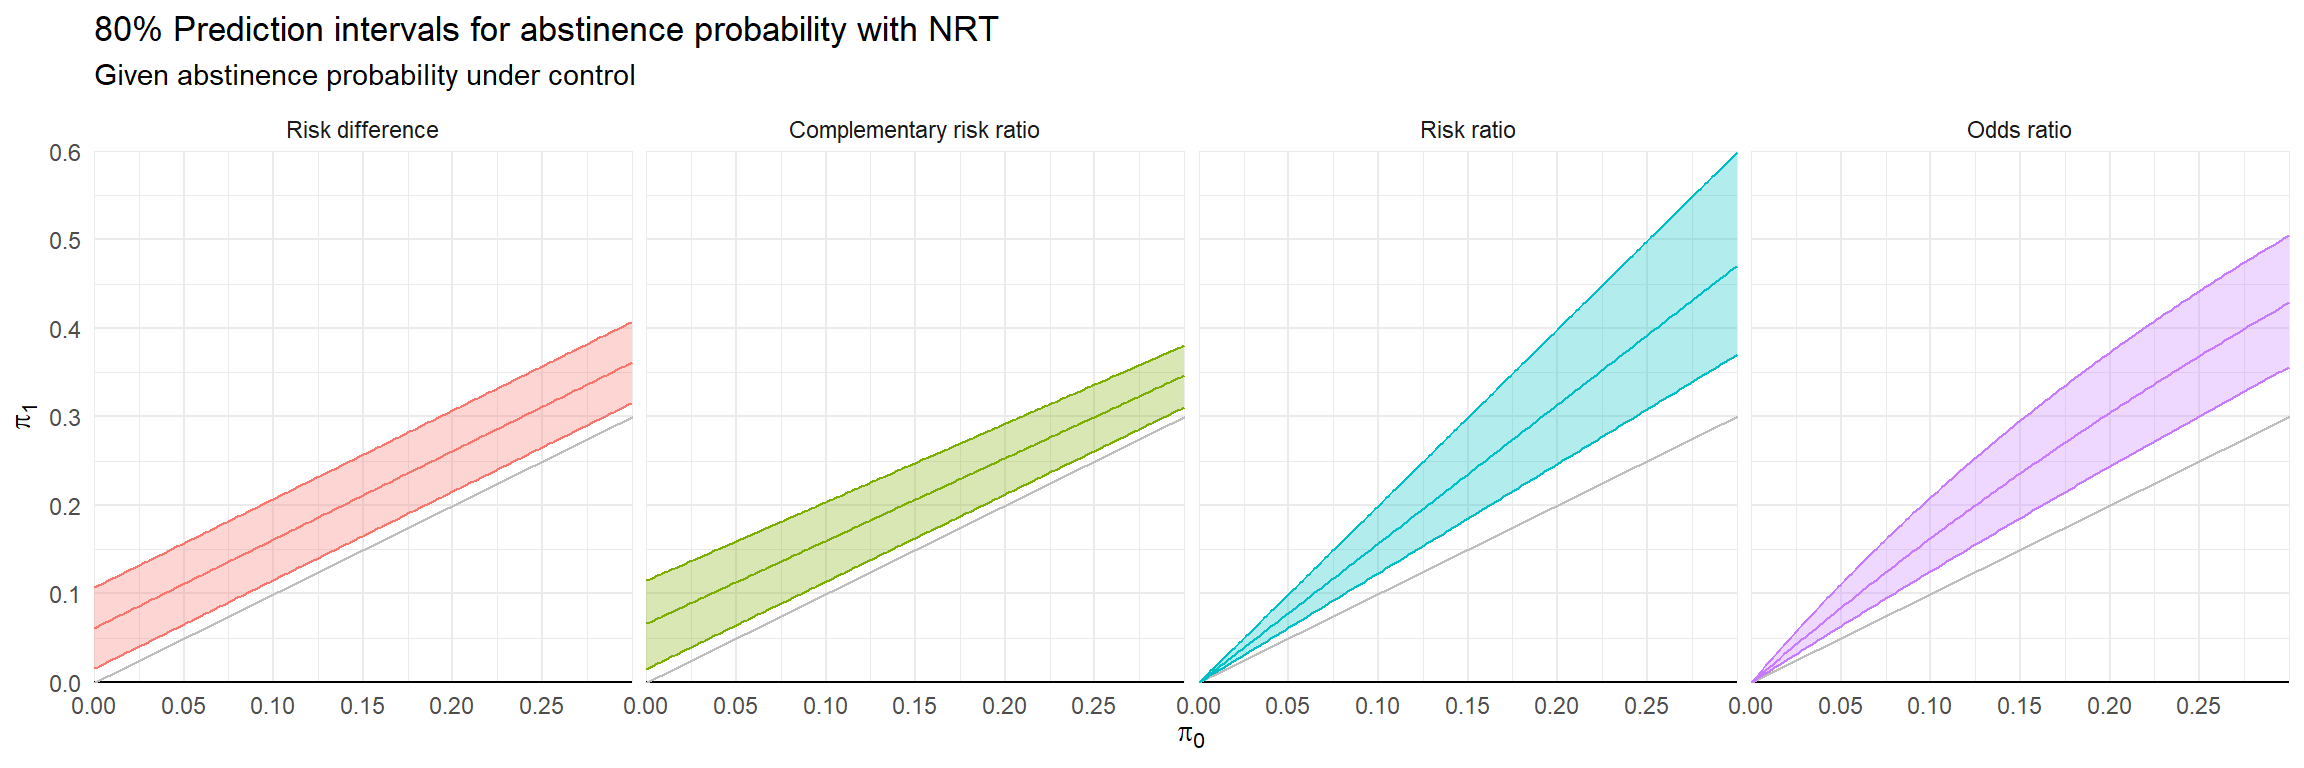
Random effects meta-analysis
- Difference ES metrics suggest very different implications and different heterogeneity
| Metric | Est | 95% CI | 80% PI | I2 |
|---|---|---|---|---|
| Odds ratio | 1.75 | 1.63-1.88 | 1.29-2.38 | 39.06 |
| Risk ratio | 1.57 | 1.48-1.66 | 1.23-1.99 | 36.88 |
| Complementary risk ratio | 1.07 | 1.06-1.08 | 1.02-1.13 | 65.51 |
| Risk difference | 0.06 | 0.05-0.07 | 0.02-0.11 | 63.50 |
Auxiliary modeling
Possible auxiliary models for \(\hat\pi_{0i}\) or \(\hat\pi_{1i}\):
Random effects meta-analysis/meta-regression of log-odds
Generalized linear mixed model (Normal-binomial)
Beta-binomial regression
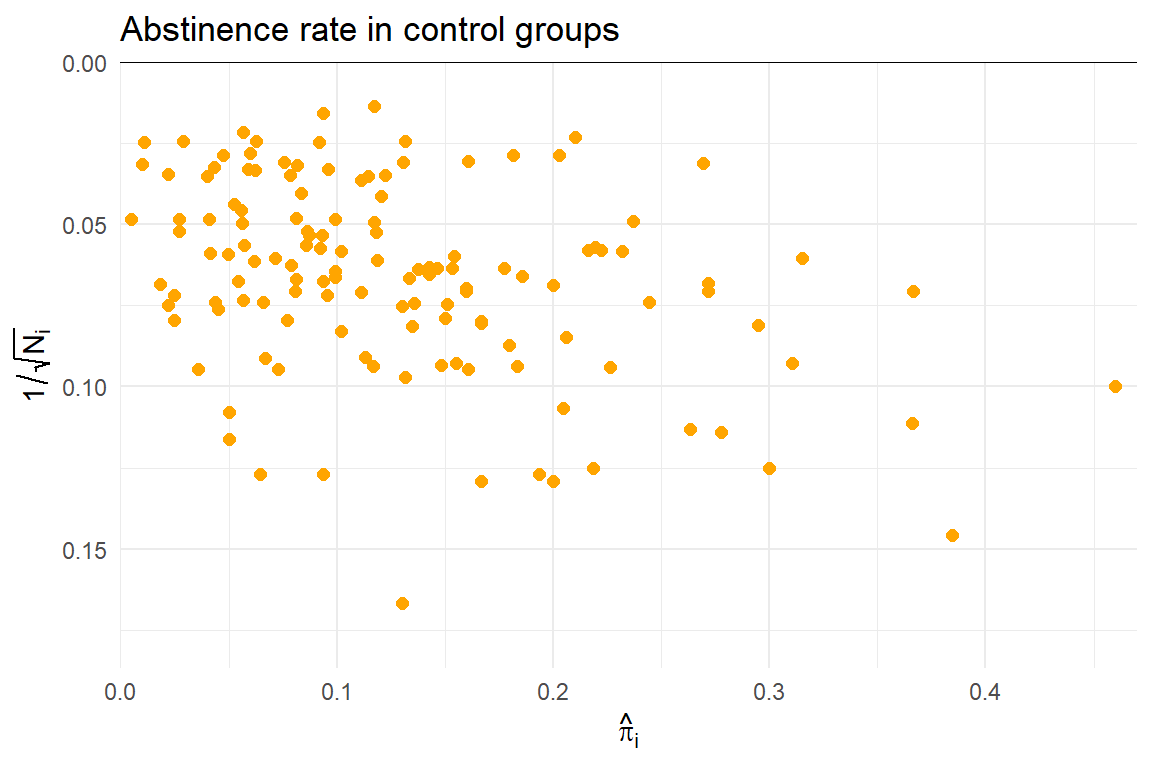
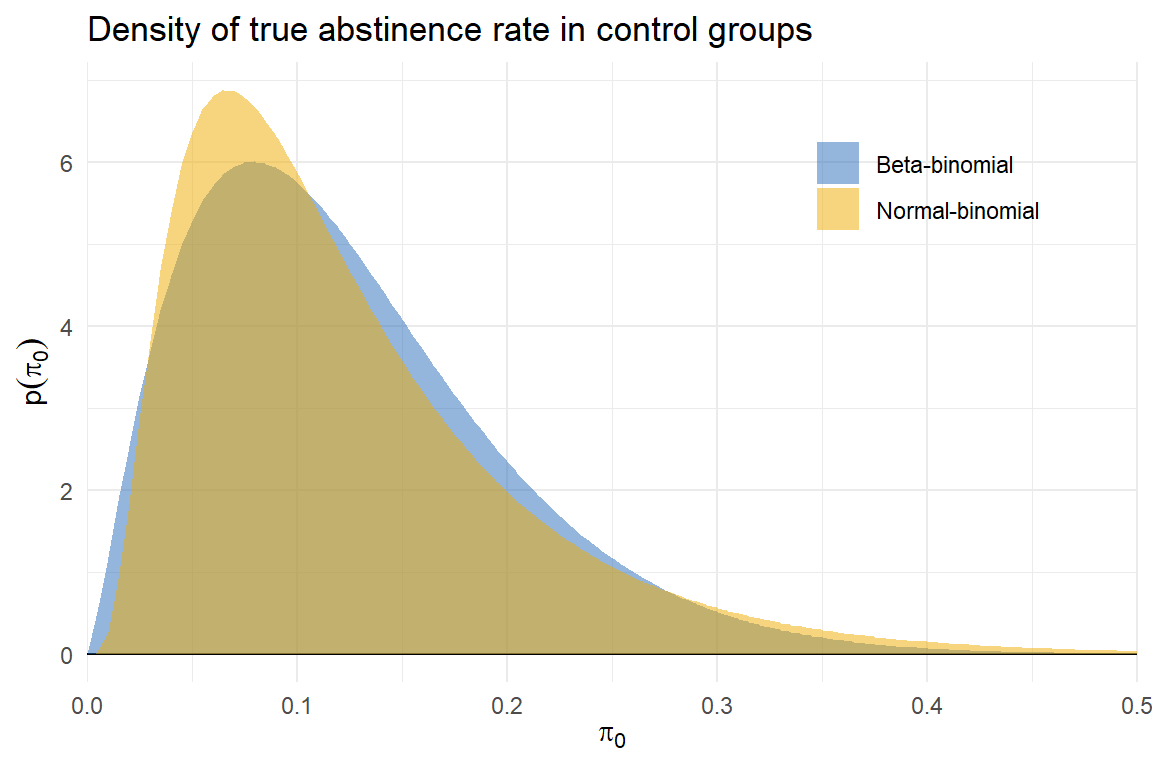
Predictive discrepancies
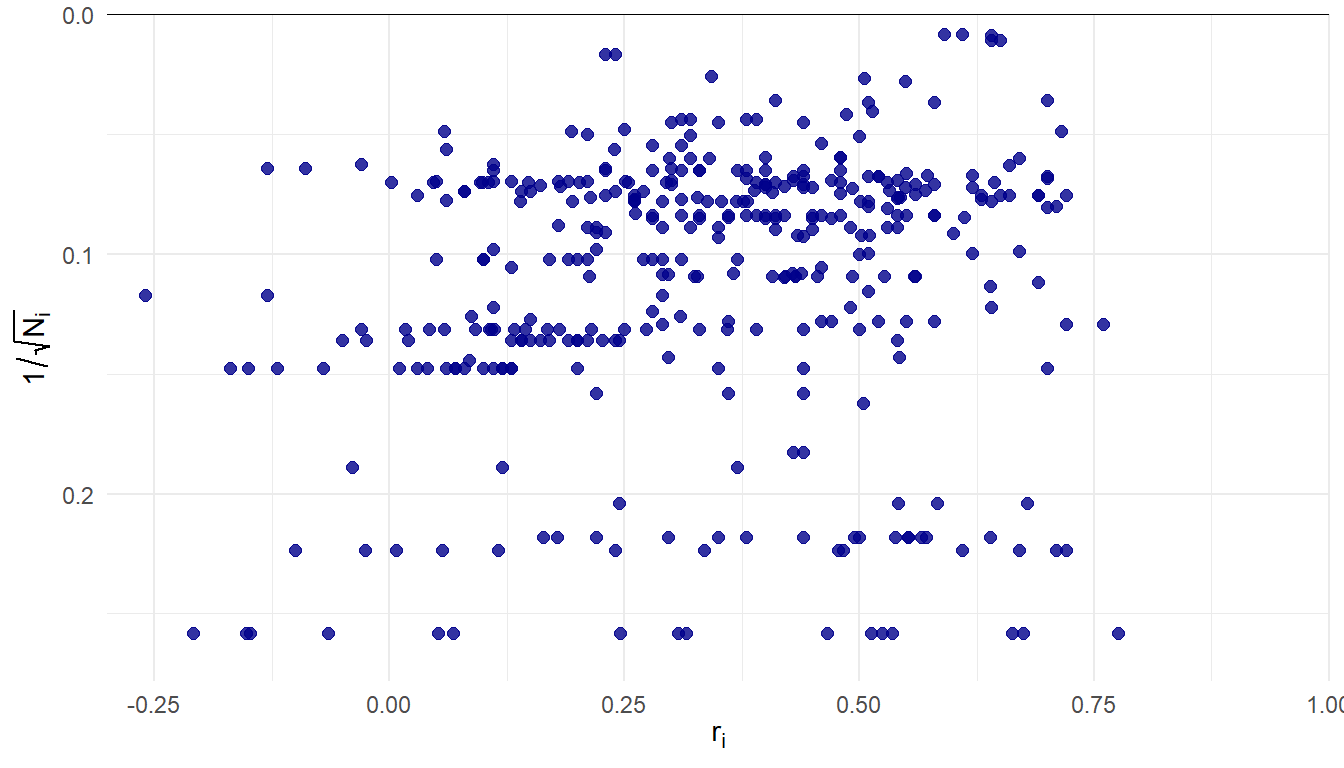
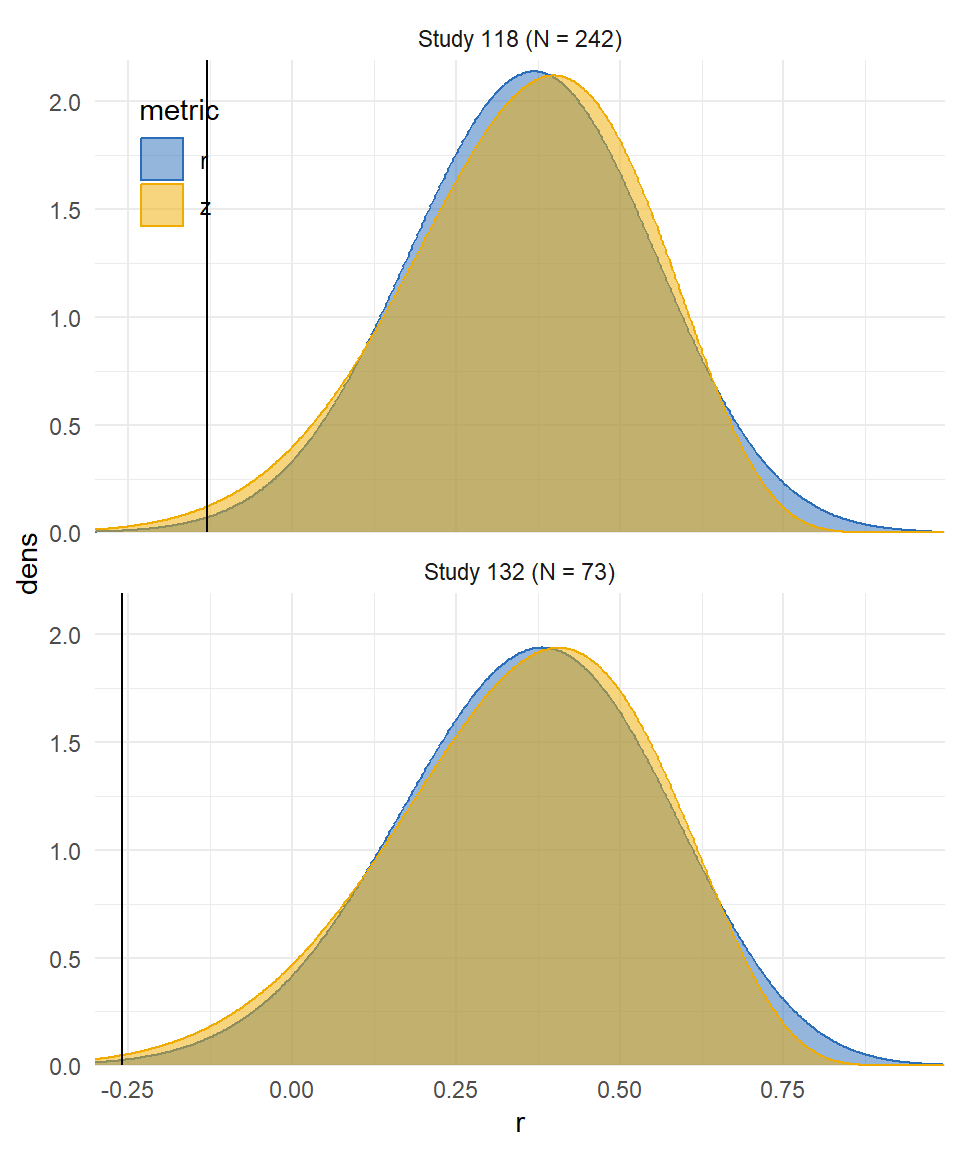
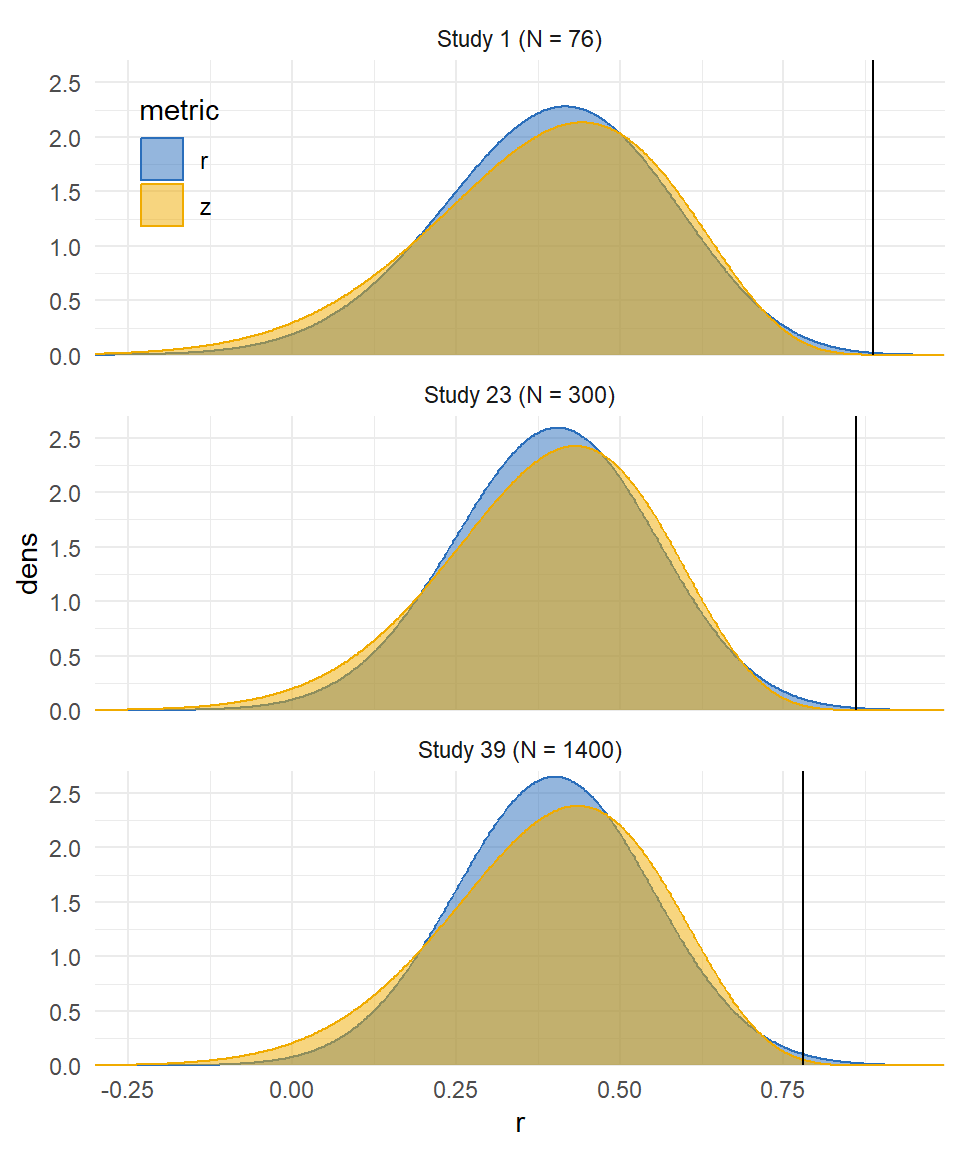
Reading comprehension and content knowledge
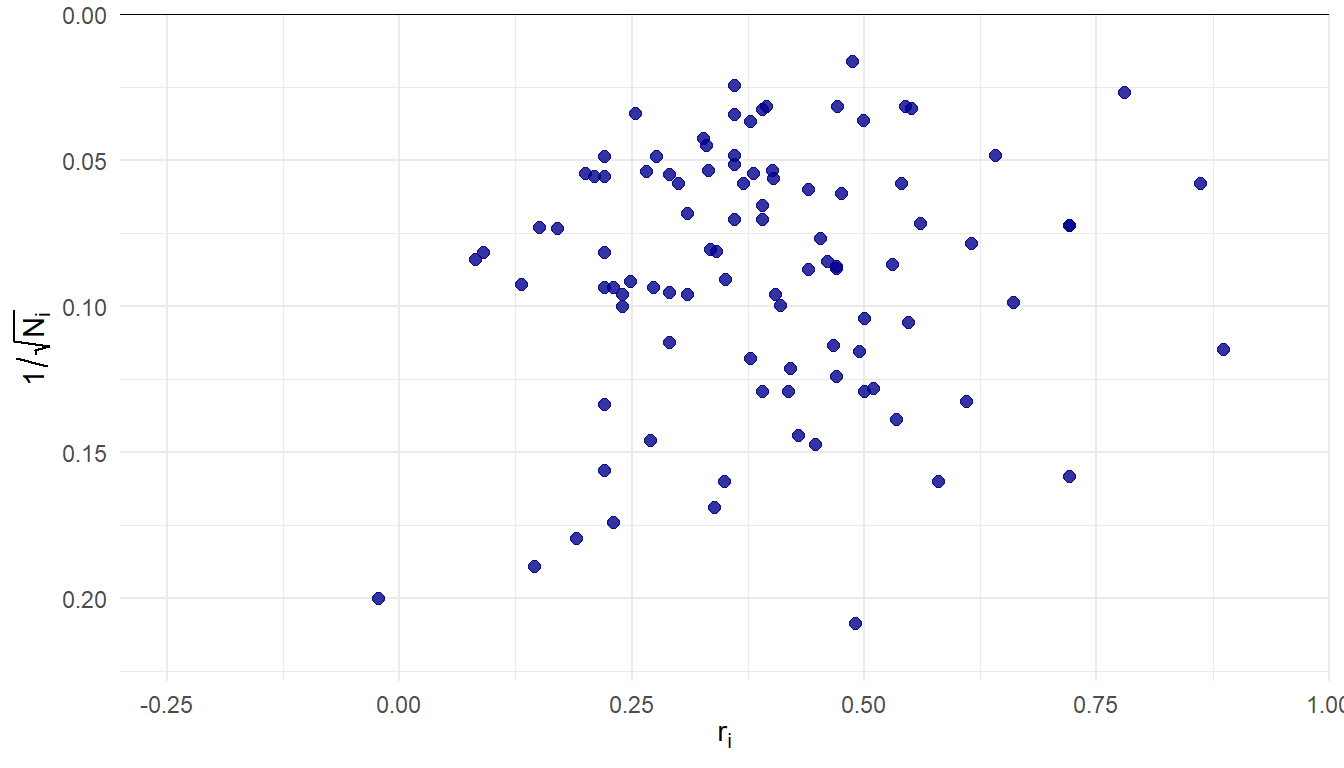
Kim and Cao (Kim and Cao 2025) reported a systematic review and meta-analysis of studies on association between reading comprehension and content knowledge.
380 correlation estimates, samples ranging from \(N_i\) = 23 to 3900 (median = 151, IQR = 76-335).
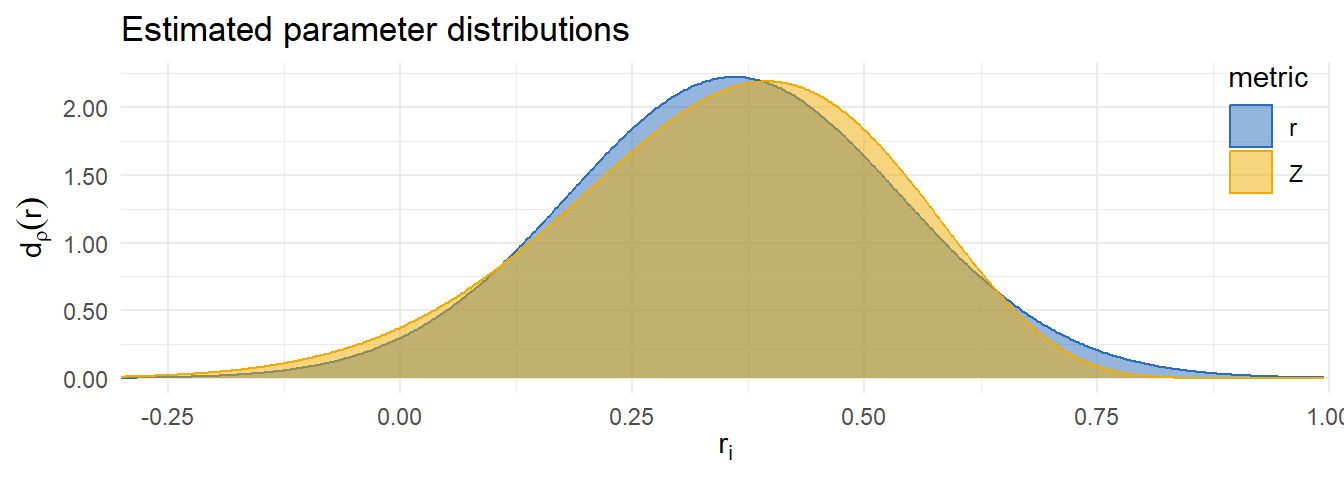
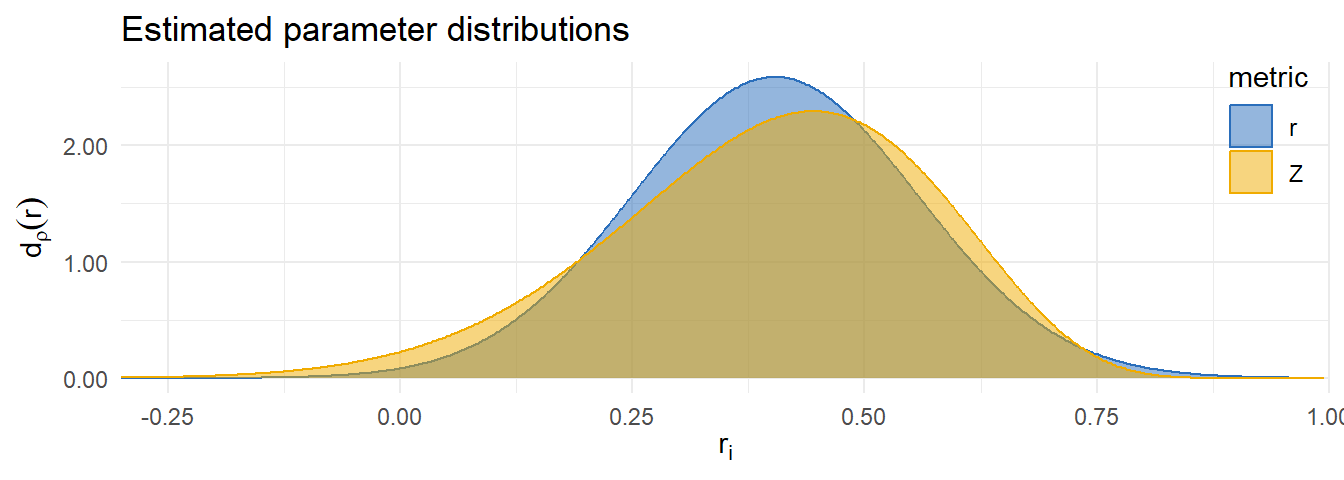
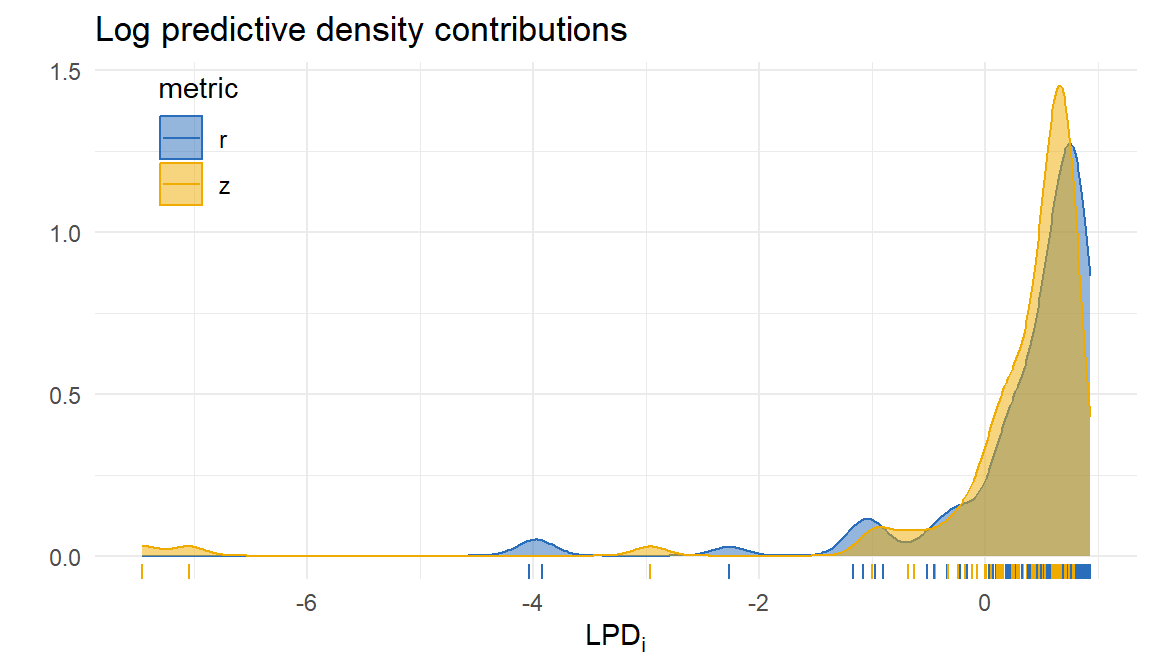
Metric comparison
| Metric | Est. | 95% CI | 80% PI | LPD | SE |
|---|---|---|---|---|---|
| r | 0.36 | 0.34-0.38 | 0.13-0.59 | 63.36 | 11.80 |
| z | 0.36 | 0.34-0.38 | 0.11-0.57 | 67.52 | 11.26 |
| Difference | -4.15 | 1.94 |
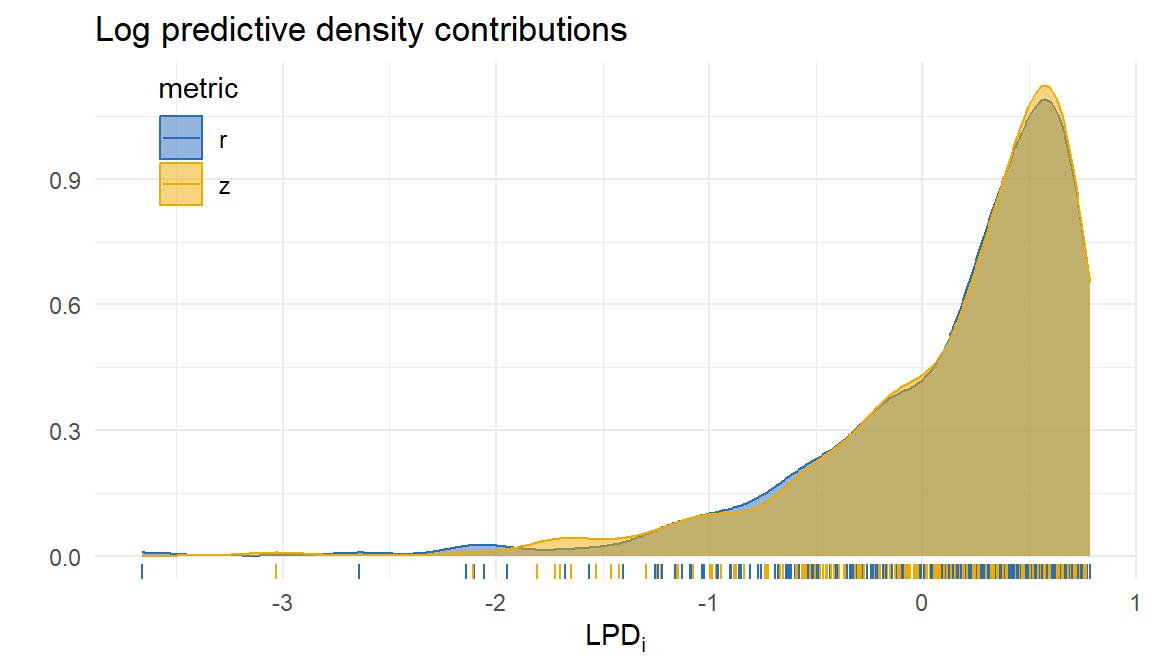
Discrepancies
Class attendance and college grades
Credé and colleagues (Credé et al. 2010) reported a systematic review and meta-analysis of studies on association between class attendance and grades / GPA in college.
99 correlation estimates, samples ranging from \(N_i\) = 23 to 3900 (median = 151, IQR = 76-335).
Metric comparison
| Metric | Est. | 95% CI | 80% PI | LPD | SE |
|---|---|---|---|---|---|
| r | 0.40 | 0.37-0.44 | 0.20-0.60 | 33.24 | 8.27 |
| z | 0.41 | 0.37-0.45 | 0.16-0.61 | 21.39 | 11.95 |
| Difference | 11.85 | 4.72 |
Discrepancies
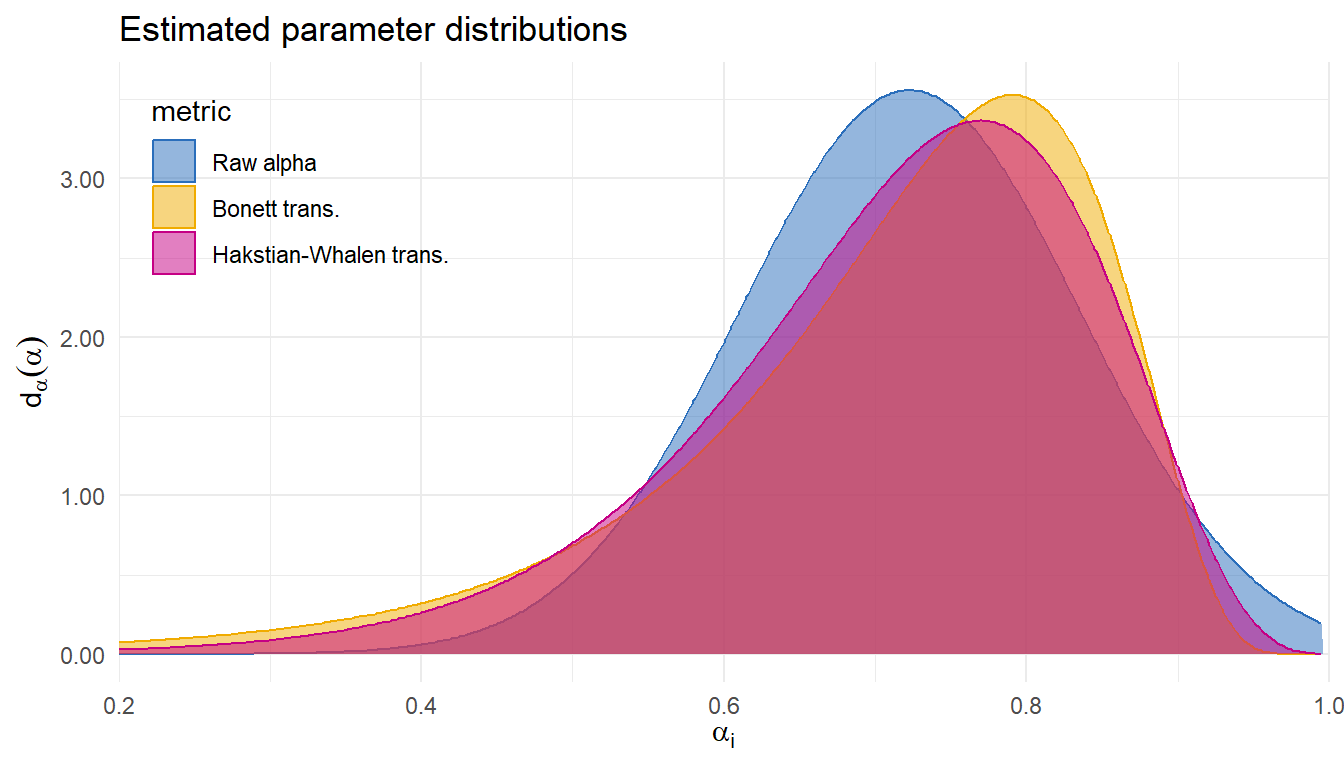
Reliability generalization of MIBS
Demir and colleagues (Demir et al. 2024) gathered 33 estimates of internal consistency (Cronbach \(\alpha\)) of the Mother-to-Infant Bonding Scale.
Sample sizes ranging from \(N_i\) = 13 to 2251 (median = 177, IQR = 98-260).
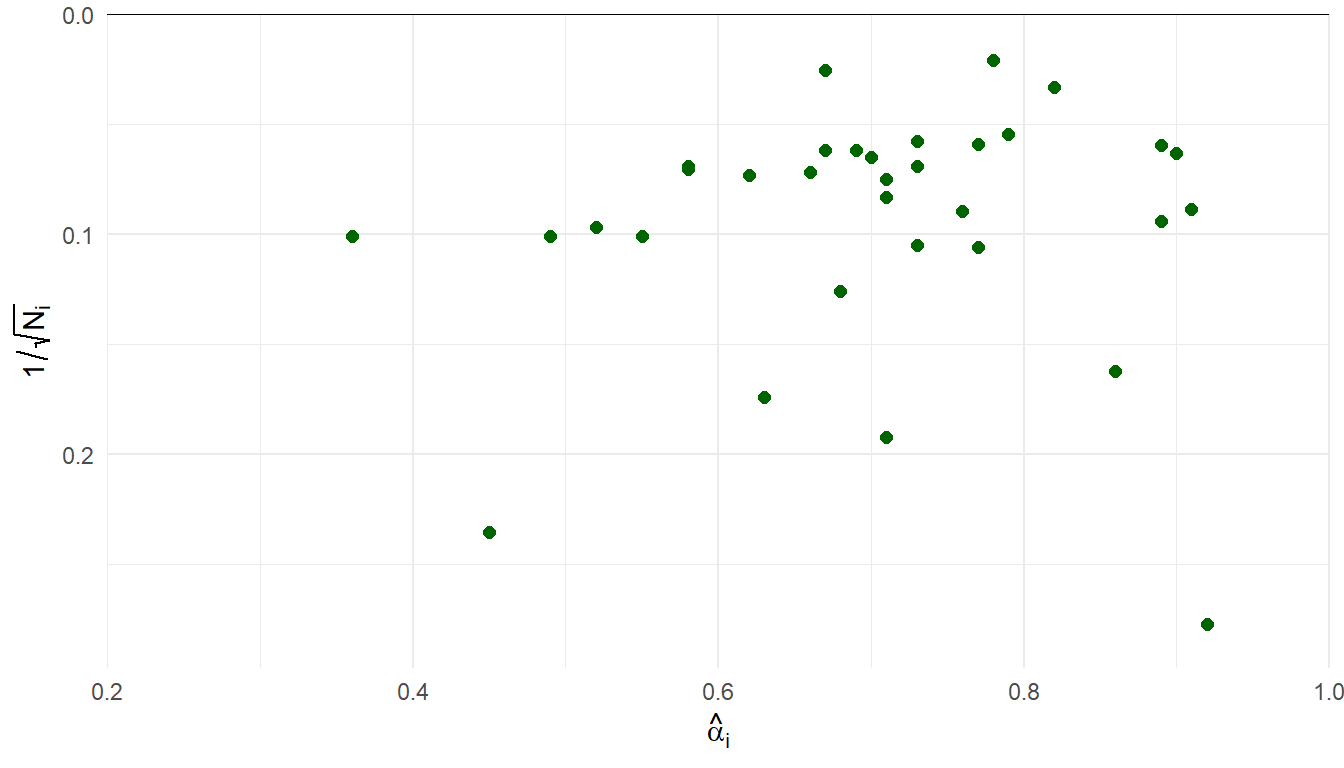
| Metric | Est. | 95% CI | 80% PI | I2 | LPD | SE |
|---|---|---|---|---|---|---|
| Raw alpha | 0.72 | 0.68-0.76 | 0.58-0.87 | 97.01 | 18.79 | 5.12 |
| Bonett trans. | 0.74 | 0.69-0.78 | 0.51-0.86 | 96.34 | 17.48 | 3.86 |
| Hakstian-Whalen trans. | 0.73 | 0.68-0.77 | 0.53-0.86 | 96.37 | 19.27 | 3.69 |
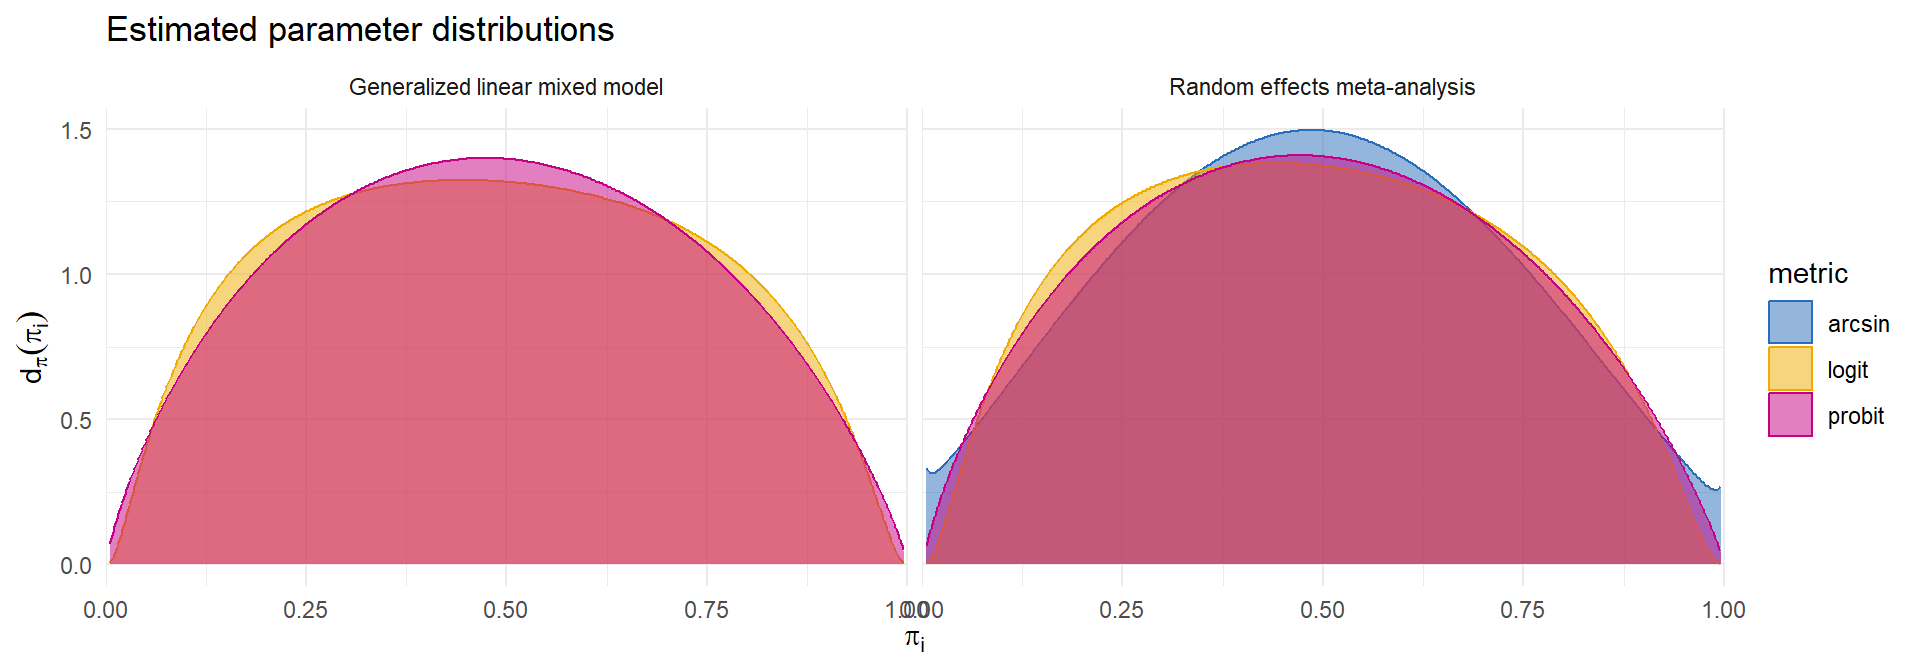
Incidence of olfactory loss in COVID-19 patients
Hannum and colleagues (Hannum et al. 2020) compiled data on rates of olfactory loss across 35 studies of COVID-19 patients.
Sample sizes ranging from \(N_i\) = 15 to 7178 (median = 95, IQR = 56.5 - 267.5).
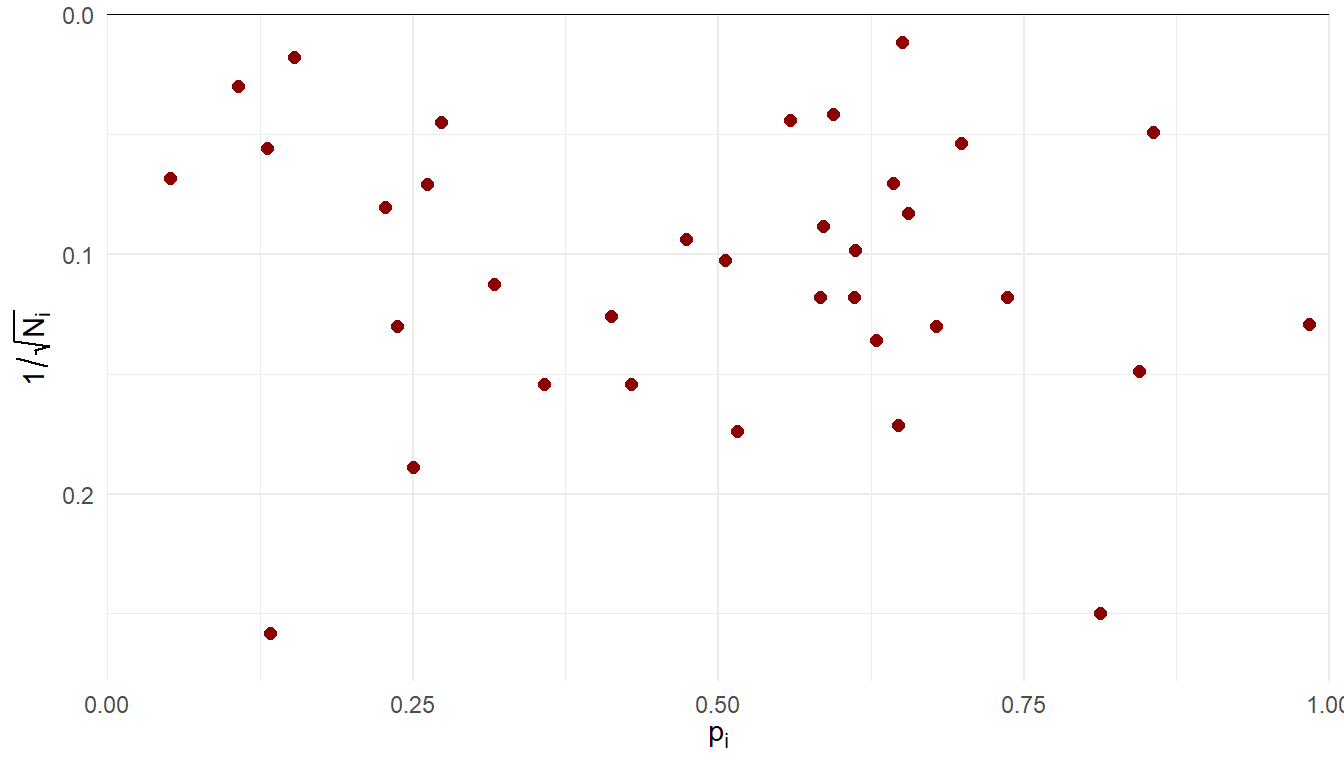
Many different transformations of \(p_i\) are used as effect size measures (identity, logit, probit, arcsin-square-root, Freeman-Tukey).
Could use conventional random effects model or generalized linear mixed model.
- Which predictive model to use?
\[ \begin{aligned} g(p_i) &\dot{\sim} \ N\left(g(\pi_i), \ \frac{h(\pi_i)}{N_i}\right) \qquad & N_i p_i &\sim \ Binom\left(N_i, \ \pi_i\right)\\ g(\pi_i) &\sim \ N\left(\mu_g, \ \tau_g^2\right) \qquad & g(\pi_i) &\sim \ N\left(\mu_g, \ \tau_g^2\right) \end{aligned} \]
Incidence of olfactory loss in COVID-19 patients
| Normal | Binomial | |||||||
|---|---|---|---|---|---|---|---|---|
| Model | Metric | Est. | 95% CI | 80% PI | LPD | SE | LPD | SE |
| RE | logit | 0.48 | 0.38-0.58 | 0.17-0.81 | -178.57 | 12.43 | -178.71 | 12.53 |
| RE | probit | 0.49 | 0.39-0.58 | 0.17-0.81 | -181.35 | 14.09 | -181.35 | 14.16 |
| RE | arcsin | 0.49 | 0.40-0.58 | 0.17-0.81 | -173.53 | 11.18 | -173.62 | 11.18 |
| GLMM | logit | 0.48 | 0.38-0.59 | 0.16-0.82 | -189.90 | 19.26 | ||
| GLMM | probit | 0.49 | 0.39-0.58 | 0.17-0.82 | -183.24 | 15.21 | ||